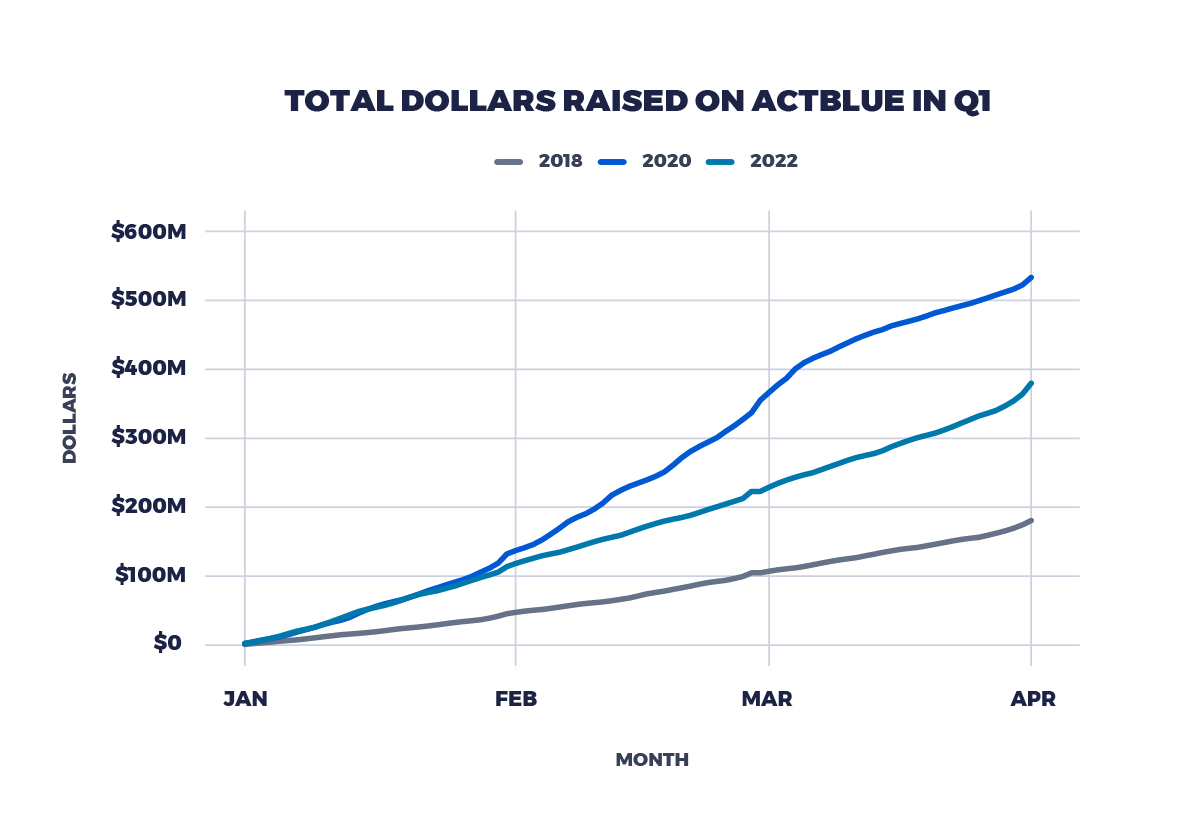
Starting the election year off strong. Small-dollar donors are starting 2022 strong and fired up about supporting Democratic candidates and progressive causes: More than 2 million unique donors gave 9.2 million contributions to 14,352 campaigns and organizations, totaling $380 million with an average contribution size of $41.09.
The total number of dollars raised in Q1 2022 was more than double the amount raised in Q1 2018, during the last midterm elections. Donors were also likely to give more than once: 57.1% of donors made multiple contributions in Q1.
The number of campaigns and organizations fundraising on ActBlue in Q1 2022 also nearly doubled since the same period in 2018, with more state and local candidates and nonprofits building digital fundraising programs. And new donors are being activated by state and local campaigns and nonprofits working on some of the biggest issues our country is facing, and the issues that affect them the most: 52.4% of first-time donors in Q1 gave their first contribution to a non-federal candidate or group or a nonprofit.
Maintaining Momentum. This quarter is building off a strong cycle so far for small-dollar donors, with donors staying engaged after the 2020 election. Our numbers show that donors have remained committed to powering change up and down the ballot during an election cycle when Democrats are working hard to protect our majorities in the House and Senate. The 2022 cycle-to-date topline numbers show that the number of unique groups raising, total contributions, and total dollars raised have more than doubled compared to the same period in 2018.
Read on to learn more about the fundraising trends across ActBlue in the first quarter of 2022 and how small-dollar donors are supporting candidates and causes across the country.
TOPLINE NUMBERS
| Q1 ’18 | Q1 ’20 | Q1 ’22 | |
|---|---|---|---|
| Contributions | 4,659,660 | 17,553,538 | 9,244,325 |
| Total Amount | $180,737,948 | $533,225,092 | $379,879,760 |
| Average Contribution Size | $38.79 | $30.38 | $41.09 |
| Unique Donors | 1,375,743 | 4,341,805 | 2,056,328 |
| Unique Campaigns, Committees, and Organizations |
7,838 | 10,954 | 14,352 |

House and Senate
One trend we’ve seen cycle over cycle: Donors come out to give for competitive races, and right now we know that Democrats are working hard in districts and states across the country to protect our majorities. Giving at the federal level continues to be strong, because small-dollar donors know they can have an impact on helping Democrats win in November.
- Compared to the last midterm election cycle, which was a historic year for small-dollar donors helping to propel Democrats to victory in the House, House and Senate candidates raised 76% more money in Q1, and over 200,000 more unique donors gave to their campaigns.
States
Small-dollar donors don’t just have their eyes on federal-level races. They are also coming out to support elections up and down the ballot, as attacks on voting rights, reproductive freedom, LGBTQIA+ rights — especially the rights of trans kids — and so many other issues come from Republicans in states around the country.
- Compared to Q1 2018, candidates for state legislatures raised nearly three times as much money from nearly double the number of contributions.
- Donors made more than 4x more contributions to in-cycle governor’s races compared to Q1 2018.
- In-cycle candidates for Attorney General raised nearly four times as much money in Q1 compared to Q1 2018, and more than twice as many unique donors gave to power their campaigns.
Investing in nonprofits. The power of grassroots fundraising not only helps win races but also helps organizations win on issues they care about in communities across the country. Q1 2022 saw nearly four times the number of unique nonprofits fundraising with our tools compared to Q1 2018. The Q1 2022 numbers also show how small-dollar donors are taking action, with double the dollars raised and nearly double the contributions than in Q1 2018. Our MICO team — Movement, Issue, and Charitable Organizations (MICO) — continues to make major strides to serve nonprofits who want to build small-dollar programs and engage their supporters.
CYCLE-TO-CYCLE COMPARISON
| 2018 cycle through Q1 ’18 | 2020 cycle through Q1 ’20 | 2022 cycle through Q1 ’22 | |
|---|---|---|---|
| Contributions | 21,005,898 | 52,231,530 | 44,556,112 |
| Total Amount | $702,839,687 | $1,589,859,837 | $1,637,172,998 |
| Average Contribution Size | $33.46 | $30.44 | $36.74 |
| Unique Donors | 3,142,692 | 7,636,611 | 5,067,094 |
| Unique Campaigns, Committees, and Organizations |
10,295 | 15,867 | 21,086 |
ACTBLUE ADVANTAGE
Whether supporting candidates or causes — or both — ActBlue makes taking action easy. With tools to build grassroots fundraising programs and teams in place to help organizers make the most of those tools, ActBlue is the trusted source that people can rely on to drive change.
| Q1 ’18 | Q1 ’20 | Q1 ’22< | |
|---|---|---|---|
| % of Contributions made with a Saved Payment Method or Digital Wallet Option | 53.1% | 64.8% | 70.0% |
| % of Contributions made via a Mobile Device | 42.2% | 61.5% | 55.6% |
RECURRING CONTRIBUTIONS
| Q1 ’18 | Q1 ’20 | Q1 ’22< | |
|---|---|---|---|
| Total Recurring Volume | $36,447,703 | $67,716,451 | $59,495,697 |
| % of Total Volume | 20.2% | 12.7% | 15.7% |


